


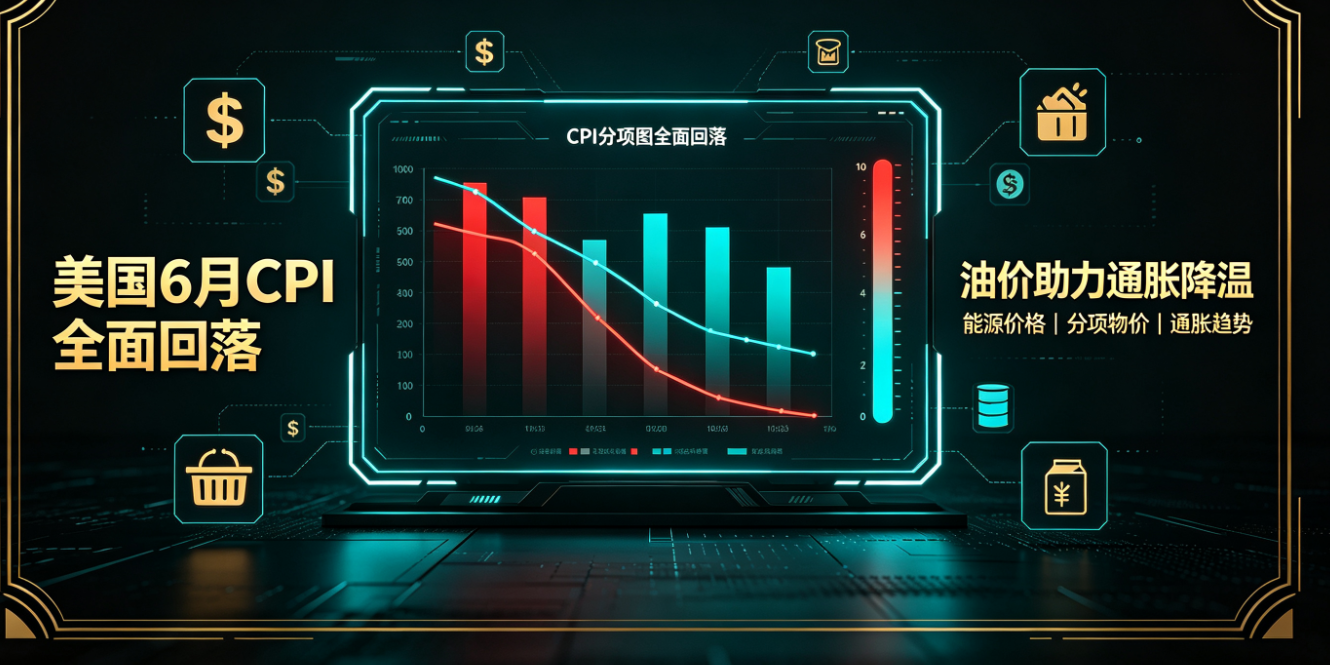
Oil Price Decline and Inflation Cooling: Analysis of US June CPI Broad Decline and Its Market Impact
Keywords
US CPI, Oil Price Decline, Inflation Slowdown, Fed Monetary Policy, Risk Assets, Gold, Market Expectations
Introduction
In June 2023, the US Consumer Price Index (CPI) data released by the Department of Labor shone a beam of light on the global financial market, which had been plagued by inflation for a long time. Driven significantly by a sharp drop in international oil prices, the June CPI recorded a broad decline. Not only did the overall inflation rate fall to its lowest since 2021, but core inflation also showed a better-than-expected cooling. This key data release quickly ignited optimism that the Fed's rate hike cycle is nearing its end, fueling a rally in risk assets and gold. This article starts from the data itself, deeply analyzes the transmission mechanism of oil price decline on inflation, discusses the impact of this change on the Fed's policy path, interprets the internal logic behind the rise in risk assets and gold, and finally looks ahead at future inflation trends and investment implications.
1. US June CPI Data Broadly Declines: Signals Behind the Numbers
According to the latest data from the US Department of Labor, the unadjusted CPI in June 2023 rose 3.0% year-on-year, down sharply from 4.0% in the previous month, the lowest increase since March 2021. The seasonally adjusted CPI rose only 0.2% month-over-month, below the market expectation of 0.3%. The more closely watched core CPI (excluding food and energy) rose 4.8% year-on-year, also below the expected 5.0%, the smallest increase since October 2021; month-over-month it rose 0.2%, also below the expected 0.3%.
This broad decline is no accident. By component, energy prices were the biggest drag: energy commodity prices fell sharply by 16.7% month-over-month in June, with gasoline prices down 25.4% and fuel oil down 12.5%. Energy's contribution to the overall CPI turned negative, becoming the main driver of inflation cooling. Meanwhile, food prices rose only 0.1% month-over-month, and core goods prices like used cars also showed monthly declines, indicating a systematic easing of goods-side inflation pressure. Although services inflation remained sticky, the marginal slowdown in housing rent growth also provided a positive signal—the owners' equivalent rent (OER) monthly growth rate fell from 0.5% to 0.4%, the lowest since early 2022.
Notably, base effects also played a role: June 2022 was the cyclical high point of US inflation (9.1% year-on-year), making the current year-on-year figures naturally lower. But after removing base effects, the visible narrowing of month-over-month data still indicates that the internal momentum of inflation is weakening. After two years of the "inflation war," this is the most milestone turning point.
2. Sharp Oil Price Drop: The Top Hero in Cooling Inflation
When analyzing June CPI data, the sharp adjustment in international oil prices is an unavoidable key variable. Brent crude futures fell from nearly $120 per barrel in June 2022 to around $75 per barrel in June 2023, a year-on-year drop of over 35%. This sharp decline directly transmitted to the retail level, causing the average gasoline price at US gas stations to fall from over $5 per gallon last summer to about $3.5 at the end of June, a drop of more than 30%.
The reasons for the oil price decline are multifaceted: First, concerns about global economic slowdown intensified, especially the manufacturing recession in Europe and weaker-than-expected economic recovery in China, dampening crude oil demand expectations. Second, OPEC+ cut production several times to support prices, but the market focused more on non-OPEC production growth (US, Brazil, Guyana) and the potential return of Iran and Venezuela to the international market. Third, the Fed's continuous aggressive rate hikes strengthened the dollar, putting additional pressure on dollar-denominated commodities. Fourth, the release of the US Strategic Petroleum Reserve (SPR) also suppressed oil prices in the first half of the year.
From the inflation transmission chain, the decline in energy prices has a strong "demonstration effect." On one hand, gasoline is directly included in the energy commodity component of CPI with a large weight; on the other hand, lower energy costs reduce input prices for downstream industries like transportation and chemicals, indirectly suppressing core goods and even services prices. The unexpected slowdown in June core CPI largely benefited from the lagged effect of the indirect transmission of energy—airfares and public transportation costs all fell month-over-month.
Therefore, oil price decline is the most powerful driver of this inflation retreat. It was the unexpected change in this variable that greatly alleviated the market's previous concerns about "persistent high inflation" in the US, creating conditions for the risk asset counteroffensive.
3. Impact of Inflation Cooling on Fed Policy Expectations: Is the End of Rate Hikes Near?
After the CPI data release, the market's first reaction was to reprice the Fed's rate hike path. Previously, the market generally believed that a 25-bp rate hike in July was almost certain, but expectations for September and beyond were divided. The June CPI coming in broadly below expectations quickly raised the assumption that "July may be the last rate hike."
Judging from recent Fed officials' statements, although some hawks still emphasize "needing to see more evidence of inflation improvement," the data itself is enough to shake the basis for aggressive rate hikes. Fed Chair Jerome Powell said at the press conference after the June FOMC meeting that the pace of rate hikes needs to be "carefully" data-dependent. Now with inflation data falling for two consecutive months and the core PCE also declining in tandem, the Fed needs to find a new balance between "over-tightening" and "incomplete anti-inflation."
According to the CME FedWatch tool, after the CPI release, the market's probability of a 25-bp hike in July remains above 90%, but the probability of another hike in September plunged from 30% to below 10%, and pricing for a rate cut in early 2024 even began to appear. This means the market believes the current rate hike cycle has basically reached its end, with the peak federal funds rate possibly in the 5.50%-5.75% range.
Of course, caution is needed: the Fed's decisions do not rely solely on one CPI indicator. The labor market remains tight; June nonfarm payrolls rose by 209,000, below expectations but still solid. Wage growth, though slowing, is still above 4% year-on-year. The stickiness of services inflation may be stronger than the data shows. Therefore, a July hike is almost certain, but the September meeting faces a greater possibility of a "skip." In other words, the broad decline in inflation data provides the Fed with "policy space" to pause rate hikes, but it does not mean a quick turn to rate cuts. The market's optimistic expectations for rate cuts may be partly ahead of the actual policy path, which will bring volatility risks in subsequent asset pricing.
4. Risk Assets and Gold Surge: Logic Interpretation
On the day of the CPI release, all three major US stock indexes closed higher, with the S&P 500 up over 1.2% and the Nasdaq up over 1.5%, reflecting the market's positive pricing of the "double good news" of inflation slowdown and policy easing. Meanwhile, international gold prices broke through previous highs, standing above $1,950 per ounce, hitting a one-month high; the US dollar index fell sharply to around 100; and the yield curve steepened downward—the 10-year Treasury yield fell from around 4.0% to about 3.85%.
Behind this linkage of asset prices is a clear internal logic:
For risk assets (stocks), inflation cooling means easing cost pressure for companies, recovery of consumer purchasing power, and a decline in Treasury yields that lowers the discount rate for equities, boosting valuation attractiveness. In particular, high-growth tech stocks and real estate, which are sensitive to interest rates due to their long duration, became the primary beneficiaries of capital inflows. Apple, Microsoft, and other tech giants hit new highs again.
For gold, its pricing core lies in real interest rates and the dollar. Inflation cooling and easing rate hike expectations led to a drop in nominal rates while inflation expectations fell more slowly, so real rates declined. The opportunity cost of holding gold decreased, and the weaker dollar further enhanced gold's appeal. More importantly, as a safe-haven asset, gold gained support amid market uncertainty about the economic outlook (soft landing or recession?).
For the bond market, after the CPI release, investors quickly bought US Treasuries, pushing short-end yields lower. The 2-year yield fell over 15 bps at one point, indicating a substantial narrowing of market pricing for near-term rate hikes. The decline in long-end yields was relatively smaller, reflecting lingering unease about long-term inflation expectations—after all, core inflation is still more than double the Fed's 2% target.
Notably, this rally was not across the board. Sectors that previously benefited from inflation trades (like energy, commodities) actually fell, reflecting market confirmation of the inflection point in the inflation cycle. Sector rotation indicates that investors are switching from "inflation trades" to "rate cut/economic recovery trades." Cyclical sectors like financials, technology, and consumer discretionary gained favor, while defensive and inflation-hedging assets saw periodic outflows.
5. Future Outlook: Can Inflation Continue to Fall? Risks Remain
Despite the encouraging June CPI data, we must be soberly aware that the sustainability of the inflation decline still faces multiple challenges.
First, oil prices are not unidirectional downward. The Russia-Ukraine conflict is unresolved, OPEC+ production cuts extend through 2024, and Russia and Saudi Arabia may further reduce supply. If the global economy recovers more than expected—especially China introducing stimulus policies—oil prices could rebound, pushing inflation higher. The crude oil market has shown signs of bottoming and rebounding recently, with WTI crude rising from a June low of $67 to around $75. If this trend continues, the energy component of July CPI may no longer be negative.
Second, core services inflation remains stubborn. Housing rent, though marginally slowing, is still at a high level of about 8%, and based on the lag effect of market rents, Rent and OER may maintain a relatively high growth rate for several months. Additionally, prices of services like car insurance and healthcare are still rising, and the wage-price spiral risk is not eliminated. The Atlanta Fed's wage tracker shows that wage growth, while modestly cooling, remains well above pre-pandemic levels.
Third, base effects will weaken in the second half of the year. The inflation base in the second half of 2022 gradually becomes lower, meaning it will be more difficult for year-on-year comparisons to continue falling. If month-over-month rates stay around 0.2% by year-end, the year-on-year figure could rebound to around 3.5%, unfavorable for the Fed to achieve its 2% target.
In terms of policy response, the Fed will likely raise rates by 25 bps in July and then enter a waiting mode. If subsequent data continue to cool, September may see a pause; conversely, if inflation stickiness exceeds expectations, another rate hike may still occur within the year. The market's pricing for "rate cuts" may be too aggressive; once the Fed explicitly denies the possibility of a cut at the September meeting, risk assets may face a pullback.
For investors, the current stage is not suitable for chasing sentiment-driven short-term rebounds. Gold benefits from the medium-to-long-term logic of falling real rates and a weaker dollar and can be allocated moderately on pullbacks. For equities, focus on sectors that are reasonably valued and benefit from an improved rate environment (e.g., tech, healthcare, financials), while diversifying risks and avoiding excessive concentration in overextended stocks. In addition, pay close attention to the July FOMC meeting and the August Jackson Hole global central bank symposium for policy guidance—these are key variables for judging subsequent asset movements.
Conclusion
The broad decline in US June CPI data in 2023 is undoubtedly a milestone in the US fight against inflation. Driven by a major drop in oil prices, both headline and core inflation came in below expectations, sending the strongest signal of "inflation peaking" to the market. This data not only reshaped expectations for the Fed's rate path—the end of hikes approaching and initial expectations for cuts—but also triggered a synchronized rally in risk assets and gold.
However, the "chronic disease" of inflation is far from eradicated. The stickiness of core services inflation, the rebound risk of energy prices, and the fading of base effects will all become "hidden reefs" on the road to sustained inflation decline. The Fed's decisions in the "last mile" will be more cautious, and market optimism may be tested by policy reality.
Looking ahead, investors should understand the structural changes behind the CPI data from a more sober perspective. Oil price decline brings short-term breathing space, but the path from tight to loose monetary policy is still long. In the game between inflation and growth, only by respecting data and maintaining balanced allocation can one capture opportunities and manage risks in volatility. The inflation drama is not over, but the June data wrote the most transformative chapter.